The Health of your Apps: Analytics in BIG-IP Cloud Edition and BIG-IQ 6.0
A few days ago, I was trying to explain to my son how a car engine works, and he said, show me don’t tell me(good thing we were discussing cars and not a certain other topic, but I digress). For some reason I didn’t have a cut-out internal combustion engine sitting around, but fortunately, Internet. …But his request was spot on. Humans can see patterns in charts and graphs that we would miss in a block of data.
Data visualization tools are not new to F5. Our AVR solution has been around for years, but it only shows data from one BIG-IP device—viewing analytics across devices required exporting data to external tools such as Splunk. With the 6.0 release, BIG-IQ offers centralized dashboards that graphically display the health and performance of your F5 devices. (Quick note: As mentioned in an earlier F5 press release, BIG-IP Cloud Edition combines F5’s broad portfolio of application services with the dramatically enhanced management, visibility, and analytics capabilities of BIG-IQ—so that's the connection in terms of the offerings mentioned in this piece's title).
Back to the main topic...BIG-IQ offers an application-centric view of the health, performance, and security of your applications and the devices that serve them. Now network and application teams can proactively see and troubleshoot application health characteristics. Better still, those analytics can trigger scale events so that application performance never suffers—without overprovisioning. To make it easier to use, BIG-IQ can even create custom, role-based portals so that app teams can see and manage the health and configuration of their own apps—without impacting other systems. Let’s take a closer look…
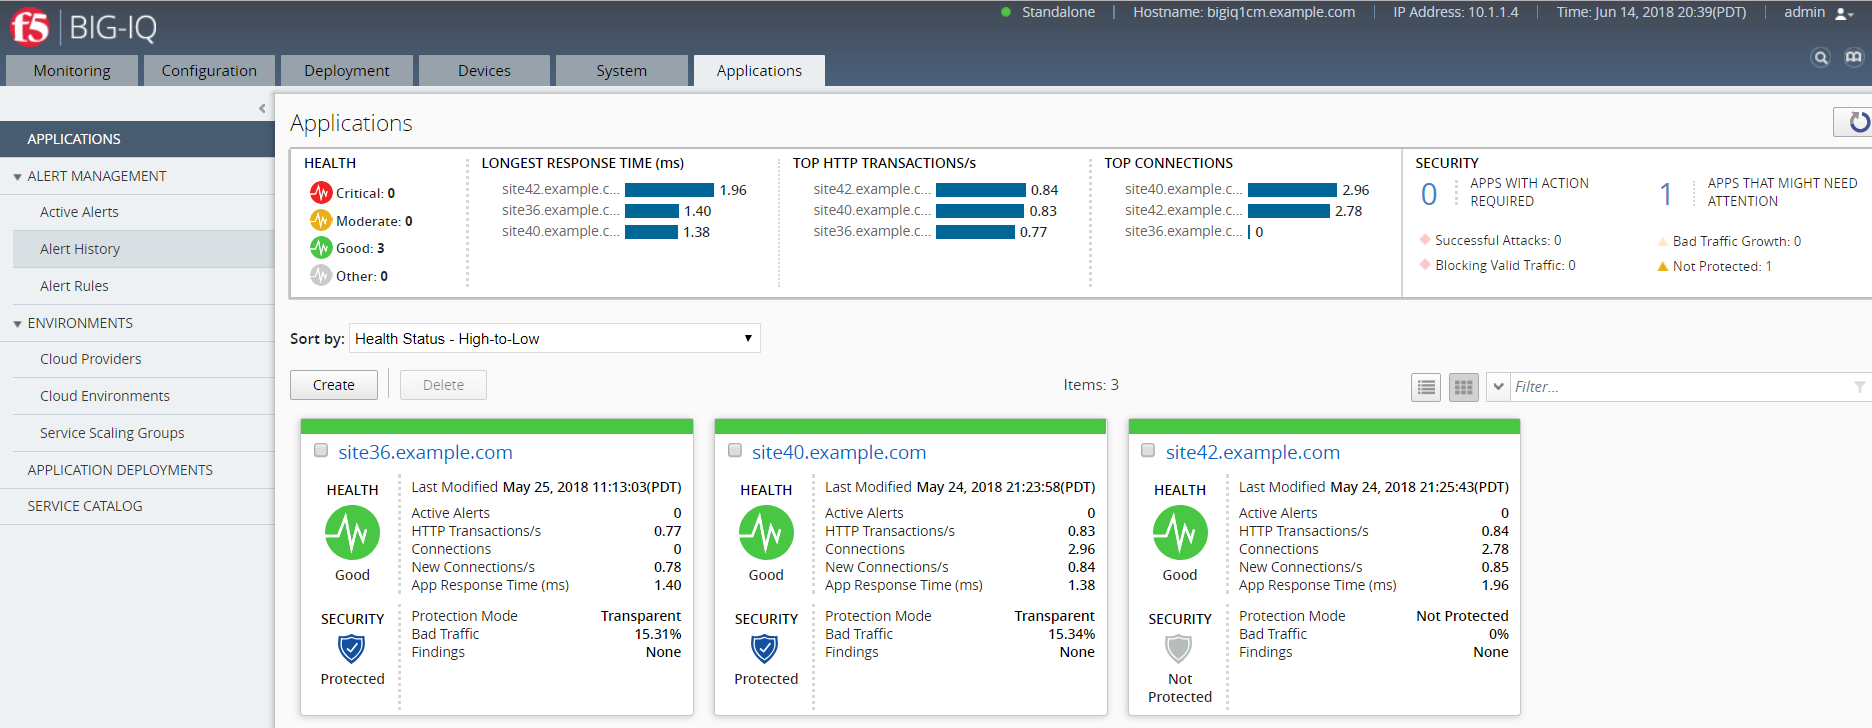
Below, we see the application portal—a summary of all apps supported by F5 devices in an environment. At a glance we can see that my 3 apps are in good shape—though one lacks security.

We can view these apps as cards, useful if you only have a few apps, or as a list. Either way, at a glance you can see the health and security status of your application as well as a few key stats such as the percentage of bad traffic, the number of alerts, and so on. Click on the app and you’d see details that enabling troubleshooting of any health and performance issues. App analytics can also trigger alerts or even a scaling event to increase the performance of your application.
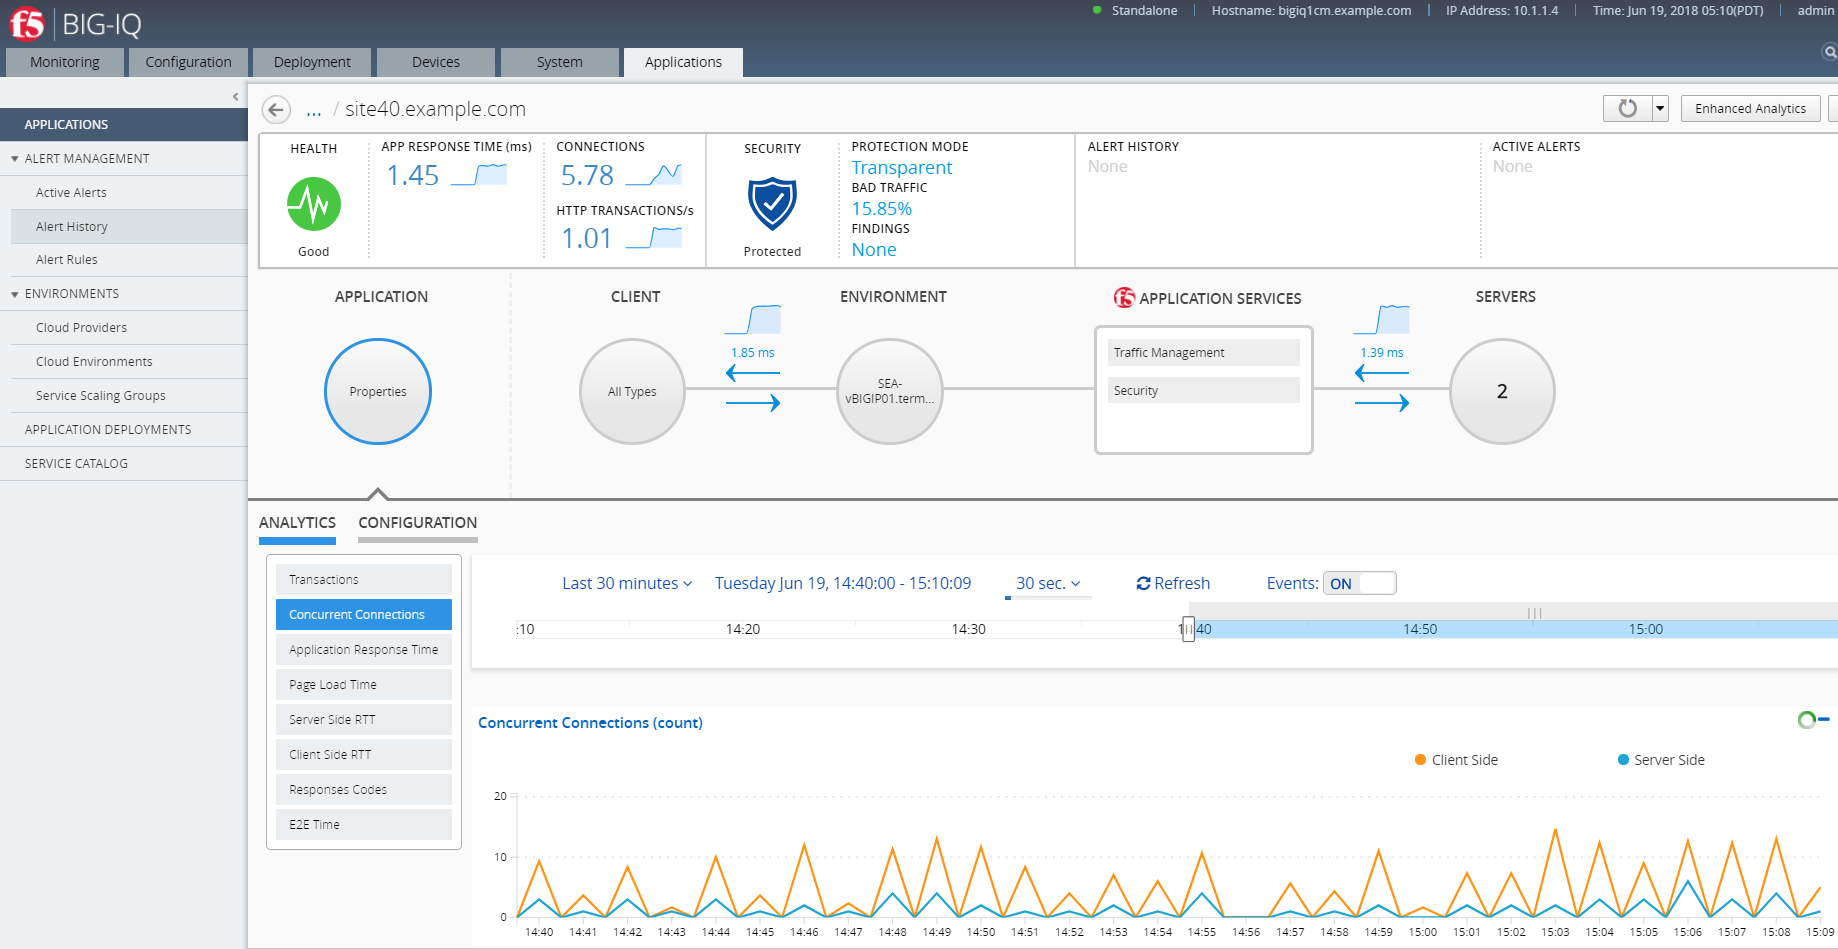
Clicking on an individual app would bring up a more detailed view, similar to what you’ll see in the next screen. Here, we find the current health, traffic performance, security, and configuration details for an application.

At the far top-right is the Enhanced Analytics button which turns on additional data collection for more extensive troubleshooting. You can enable Enhanced Analytics on multiple applications at once to the enhanced data objects in the HTTP dashboard (by clicking Monitoring > DASHBOARDS > Local Traffic > HTTP). By default, the collection of enhanced analytics will be off. The Enhanced Analytics option doesn’t impact BIG-IQ performance – but a lot of data is collected and your storage will likely be impacted. By default,you can enable up to 20 applications simultaneously in Enhanced Analytics mode. Details on the additional data can be found in the BIG-IQ documentation (https://support.f5.com/kb/en-us/products/big-iq-centralized-mgmt/manuals/product/big-iq-centralized-management-monitoring-and-managing-application-services-6-0-0/3.html#unique_377701420).
The center of the screen also has what's called an Application Configuration Map. Clicking on that would provide detailed analytics and configuration information on application traffic, client traffic, performance of the underlying hardware, F5 application services and the performance of servers hosting the applicaton.
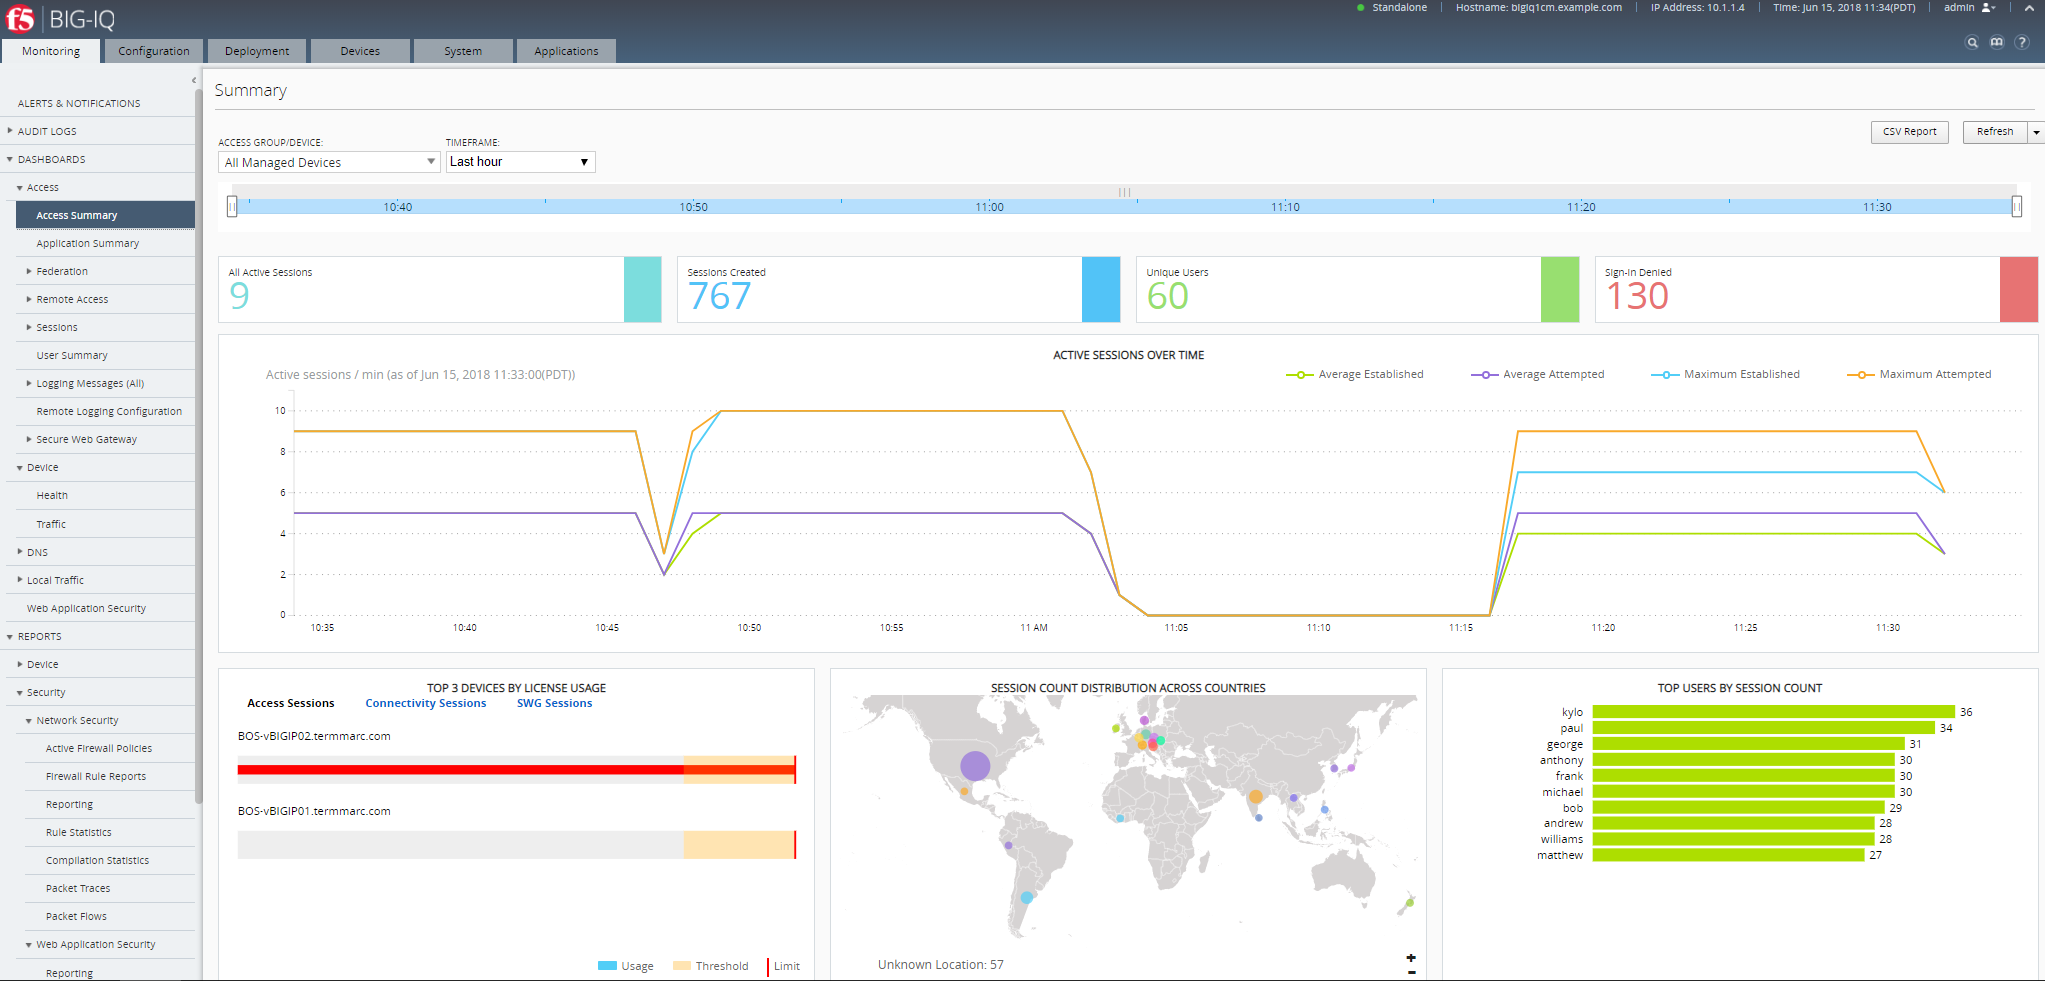
While application security analytics are new and highly useful, don’t neglect the device and security analytics found in the Monitoring Tab of BIG-IQ (shown in the image below). Under this tab you will find dashboards for Access, Device health and traffic, DNS services and Local Traffic Management. This tab also includes central alerts, security, and performance reports and event tracking.

Analytics in BIG-IQ does require the use of Data Collection Devices (DCDs). These offload the collection of analytic data from your BIG-IP devices—so BIG-IP performance won’t be affected. Licenses for DCDs are available free of charge. Be sure to ask for the free support SKU for your DCDs as well so that they will be eligible for upgrades.
Additional Resources
